


Introduction to Financial Ratios
When computing financial ratios and when doing other financial statement analysis always keep in mind that the financial statements reflect the accounting principles. This means assets are generally not reported at their current value. It is also likely that many brand names and unique product lines will not be included among the assets reported on the balance sheet, even though they may be the most valuable of all the items owned by a company.
These examples are signals that financial ratios and financial statement analysis have limitations. It is also important to realize that an impressive financial ratio in one industry might be viewed as less than impressive in a different industry.
Our explanation of financial ratios and financial statement analysis is organized as follows:
-
Balance Sheet
- General discussion
- Common-size balance sheet
- Financial ratios based on the balance sheet
-
Income Statement
- General discussion
- Common-size income statement
- Financial ratios based on the income statement
-
Statement of Cash Flows
General Discussion of Balance Sheet
The balance sheet reports a company's assets, liabilities, and stockholders' equity as of a specific date, such as December 31, 2015, March 31, 2015, etc.
The accountants' cost principle and the monetary unit assumption will limit the assets reported on the balance sheet. Assets will be reported
(1) only if they were acquired in a transaction, and
(2) generally at an amount that is not greater than the asset's cost at the time of the transaction.This means that a company's creative and effective management team will not be listed as an asset. Similarly, a company's outstanding reputation, its unique product lines, and brand names developed within the company will not be reported on the balance sheet. As you may surmise, these items are often the most valuable of all the things owned by the company. (Brand names purchased from another company will be recorded in the company's accounting records at their cost.)
The accountants' matching principle will result in assets such as buildings, equipment, furnishings, fixtures, vehicles, etc. being reported at amounts less than cost. The reason is these assets are depreciated. Depreciation reduces an asset's book value each year and the amount of the reduction is reported as Depreciation Expense on the income statement.
While depreciation is reducing the book value of certain assets over their useful lives, the current value (or fair market value) of these assets may actually be increasing. (It is also possible that the current value of some assets—such as computers—may be decreasing faster than the book value.)
Current assets such as Cash, Accounts Receivable, Inventory, Supplies, Prepaid Insurance, etc. usually have current values that are close to the amounts reported on the balance sheet.
Current liabilities such as Notes Payable (due within one year), Accounts Payable, Wages Payable, Interest Payable, Unearned Revenues, etc. are also likely to have current values that are close to the amounts reported on the balance sheet.
Long-term liabilities such as Notes Payable (not due within one year) or Bonds Payable (not maturing within one year) will often have current values that differ from the amounts reported on the balance sheet.
Stockholders' equity is the book value of the company. It is the difference between the reported amount of assets and the reported amount of liabilities. For the reasons mentioned above, the reported amount of stockholders' equity will therefore be different from the current or market value of the company.
By definition the current assets and current liabilities are "turning over" at least once per year. As a result, the reported amounts are likely to be similar to their current value. The long-term assets and long-term liabilities arenot "turning over" often. Therefore, the amounts reported for long-term assets and long-term liabilities will likely be different from the current value of those items.
The remainder of our explanation of financial ratios and financial statement analysis will use information from the following balance sheet:

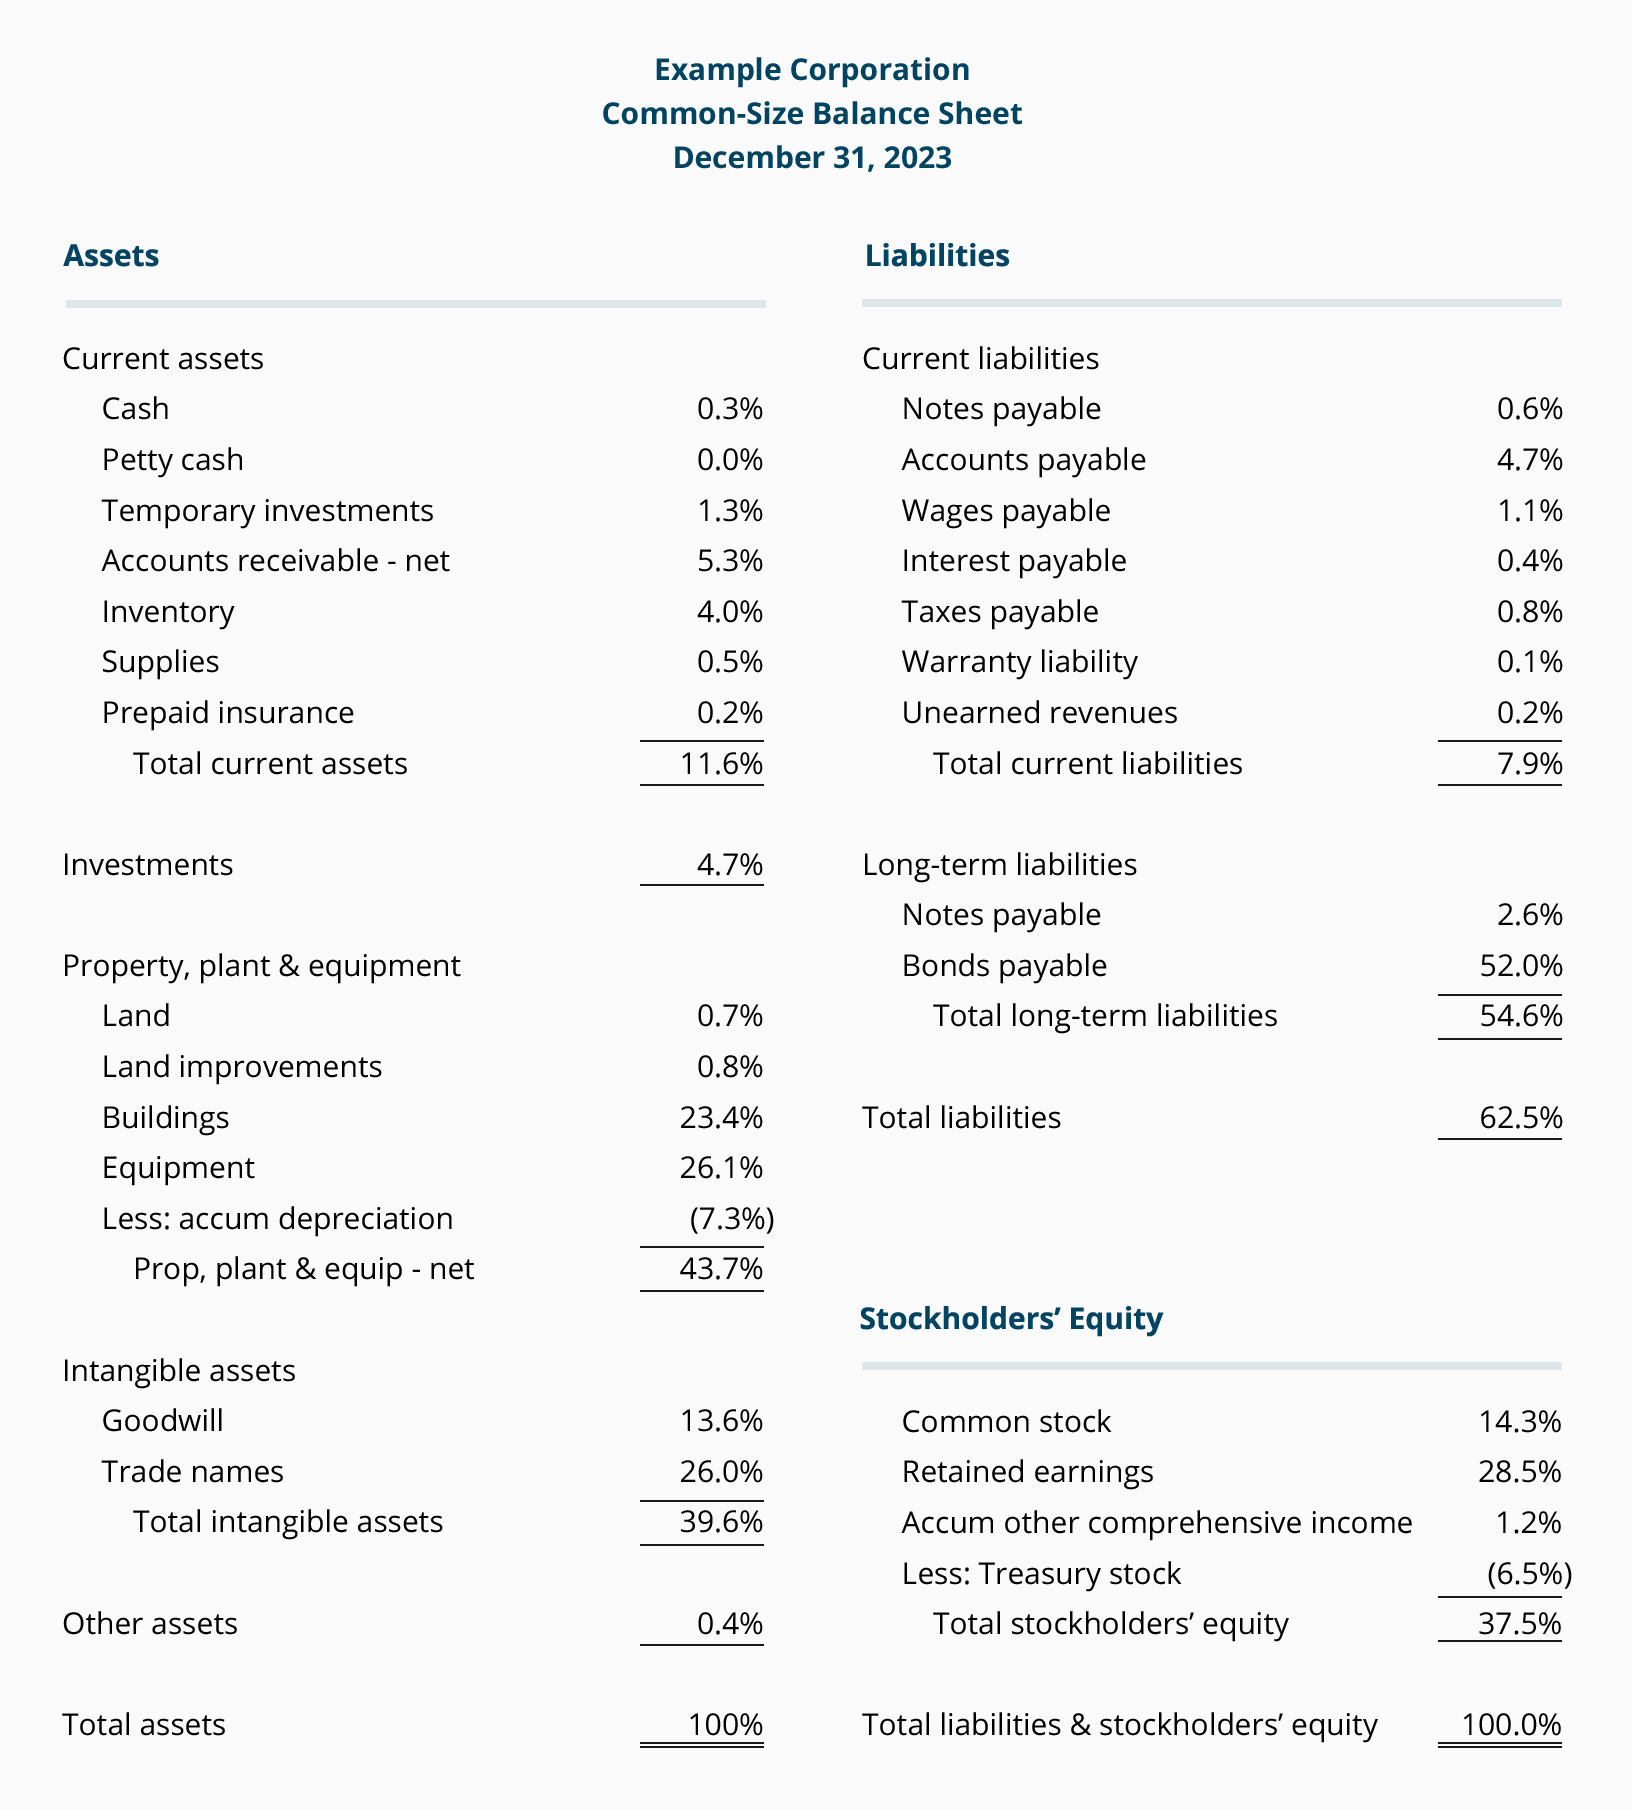
Common-Size Balance Sheet
One technique in financial statement analysis is known as vertical analysis. Vertical analysis results in common-size financial statements. A common-size balance sheet is a balance sheet where every dollar amount has been restated to be a percentage of total assets. We will illustrate this by taking Example Company's balance sheet (shown above) and divide each item by the total asset amount $770,000. The result is the following common-size balance sheet for Example Company:

The benefit of a common-size balance sheet is that an item can be compared to a similar item of another company regardless of the size of the companies. A company can also compare its percentages to the industry's average percentages. For example, a company with Inventory at 4.0% of total assets can look to its industry statistics to see if its percentage is reasonable. (Industry percentages might be available from an industry association, library reference desks, and from bankers. Many banks have memberships in Risk Management Association (RMA), an organization that collects and distributes statistics by industry.) A common-size balance sheet also allows two businesspersons to compare the magnitude of a balance sheet item without either one revealing the actual dollar amounts.

» Tin mới nhất:
- Nhận biết "Điểm mù" trong đầu tư chứng khoán (24/04/2024)
- Kho vũ khí tuyệt vời để xây dựng kỹ năng viết tiếng Anh cho sinh viên (18/04/2024)
- CÁC YẾU TỐ BỊ LOẠI TRỪ KHI TÍNH GDP (18/04/2024)
- Chiến lược tăng trưởng quốc tế của Tesco (18/04/2024)
- Barra tại GM đối mặt với những thách thức (18/04/2024)
» Các tin khác:
- General Discussion of Income Statement (25/10/2016)
- Cải cách dịch vụ hành chính công ở Việt Nam hiện nay và những vấn đề đặt ra (18/10/2016)
- THỦ TỤC HẢI QUAN ĐIỆN TỬ TỪNG BƯỚC ĐÁP ỨNG CÁC TIÊU CHUẨN QUỐC TẾ VỀ HẢI QUAN HIỆN ĐẠI (18/10/2016)
- Một "con hổ" khác của Châu Á (18/10/2016)
- Công việc tương lai - những kỹ năng cần thiết (18/10/2016)
- Bitcoin- xu thế thời công nghệ ( phần 1) (18/10/2016)
- Bao thanh toán ở Việt Nam (18/10/2016)
- FPT Retail bắt tay Vinamilk mở chuỗi cửa hàng bán lẻ (18/10/2016)
- FPT Retail bắt tay Vinamilk mở chuỗi cửa hàng bán lẻ (18/10/2016)
- Marketing địa phương (18/10/2016)